※ Details that are not on the homepage can be found in the SR report - Data sector.
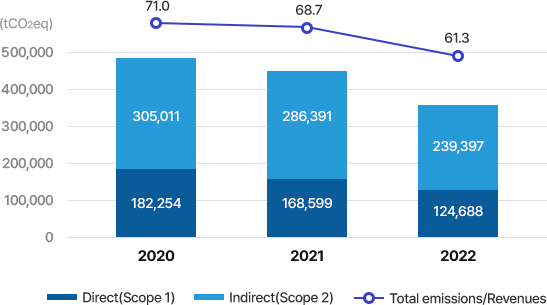
| Unit | 2020 | 2021 | 2022 | ||
|---|---|---|---|---|---|
| Total (Scope 1+2) | tCO2eq | 487,265 | 454,990 | 364,085 | |
| Direct(Scope 1) | 182,254 | 168,599 | 124,688 | ||
| Indirect(Scope 2) | 305,011 | 286,391 | 239,397 | ||
| Total emissions/Revenues | tCO2eq/KRW billion | 71.0 | 68.7 | 61.3 | |
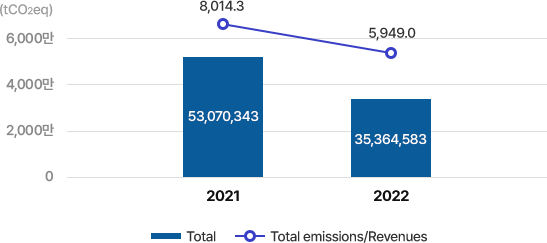
| Unit | 2021 | 2022 | ||
|---|---|---|---|---|
| Total (Scope 3) | tCO2eq | 53,070,343 | 35,364,583 | |
| #1. purchased goods and services | 2,376,535 | 4,087,391 | ||
| #2. capital goods | 미산정 | 2,745 | ||
| #3. fuel and energy related activities | 46,247 | 19,794 | ||
| #4. transportation and distribution | 522 | 12,596 | ||
| #5. waste generated in operations | 4,501 | 3,455 | ||
| #6. business travel | 476 | 684 | ||
| #7. employee commuting | 3,819 | 2,500 | ||
| #11. use of sold products | 50,630,496 | 31,230,651 | ||
| #12. end of life treatment of sold products | 7,747 | 4,767 | ||
| Total emissions/Revenues | tCO2eq/KRW billion | 8,014.3 | 5,949.0 | |
| Unit | 2022 | |||
|---|---|---|---|---|
| Category 11 (Use of sold products) | tCO2eq | 17,547,016 | ||
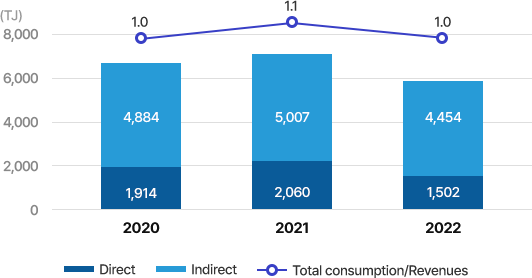
| Unit | 2020 | 2021 | 2022 | ||
|---|---|---|---|---|---|
| Energy consumption | TJ | 6,798 | 7,067 | 5,956 | |
| Direct | 1,914 | 2,060 | 1,502 | ||
| Indirect1) | 4,884 | 5,007 | 4,454 | ||
| Total emissions/Revenues | TJ/KRW billion | 1.0 | 1.1 | 1.0 | |
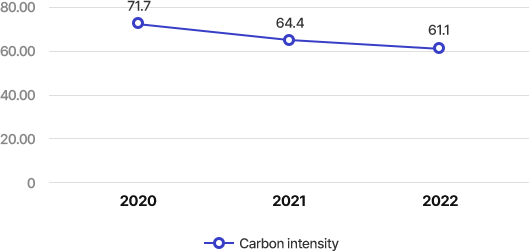
| Unit | 2020 | 2021 | 2022 | |
|---|---|---|---|---|
| Carbon Intensity1) | tCO2eq/TJ | 71.7 | 64.4 | 61.1 |
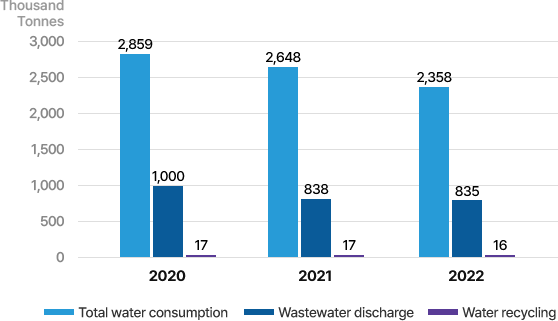
| Unit | 2020 | 2021 | 2022 | ||
|---|---|---|---|---|---|
| Total water consumption | Thousand Tonnes | 2,859 | 2,648 | 2,358 | |
| Water supply | 2,859 | 2,648 | 2,358 | ||
| Ground freshwater(River, Lake) | 0 | 0 | 0 | ||
| Groundwater | 0 | 0 | 0 | ||
| Sea water | 0 | 0 | 0 | ||
| Waste water dischare | 1,000 | 838 | 835 | ||
| Water recycling | 17 | 17 | 16 | ||
| Water stress area1) | - | N.A | N.A | N.A | |
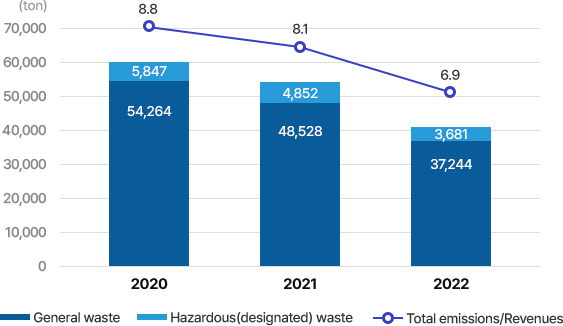
| Unit | 2020 | 2021 | 2022 | ||
|---|---|---|---|---|---|
| Total waste consumption (general + hazardous) | ton | 60,111 | 53,380 | 40,925 | |
| Recycled(external) | 28,189 | 26,315 | 19,885 | ||
| Incinerated(internal) | 22,152 | 19,217 | 14,113 | ||
| Incinerated(external) | 2,462 | 1,776 | 1,224 | ||
| Landfill(external) | 7,308 | 6,072 | 5,704 | ||
| General Waste | ton | 54,264 | 48,528 | 37,244 | |
| Recycled(external) | 25,904 | 24,312 | 18,192 | ||
| Incinerated(internal) | 21,997 | 19,083 | 14,015 | ||
| Incinerated(external) | 218 | 0 | 19 | ||
| Landfill(external) | 6,145 | 5,133 | 5,019 | ||
| Hazardous (designated) waste | ton | 5,847 | 4,852 | 3,681 | |
| Recycled(external) | 2,285 | 2,003 | 1,692 | ||
| Incinerated(internal) | 155 | 134 | 98 | ||
| Incinerated(external) | 2,244 | 1,776 | 1,206 | ||
| Landfill(external) | 1,163 | 939 | 685 | ||
| Total emissions/Revenues | Tonnes/KRW billion | 8.8 | 8.1 | 6.9 | |
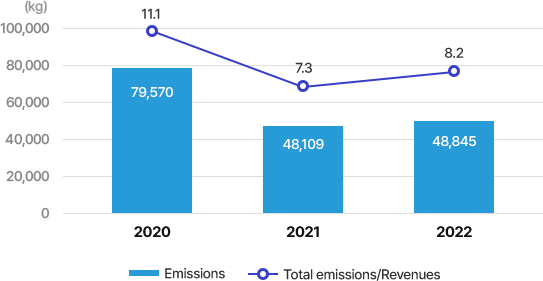
| Unit | 2020 | 2021 | 2022 | ||
|---|---|---|---|---|---|
| Air pollution Emissions | ㎏ | 79,570 | 48,109 | 48,845 | |
| SOx | 1,972 | 1,494 | 2,828 | ||
| NOx | 44,677 | 18,789 | 18,115 | ||
| TSP | 32,921 | 27,826 | 27,902 | ||
| Total emissions/Revenues | kg/KRW billion | 11.1 | 7.3 | 8.2 | |
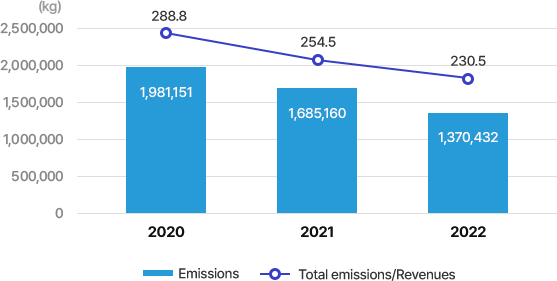
| Unit | 2020 | 2021 | 2022 | ||
|---|---|---|---|---|---|
| Total Emissions1) | ㎏ | 1,981,151 | 1,685,160 | 1,370,432 | |
| 2-propanol(67-63-0) | 58,325 | 60,511 | 58,820 | ||
| Ethyl benzene(100-41-4) | 345,492 | 289,801 | 250,277 | ||
| Toluene(108-88-3) | 23,462 | 25,493 | 26,637 | ||
| Xylene(1330-20-7) | 1,533,319 | 1,289,644 | 1,015,724 | ||
| Ethylene(74-85-1) | 20,553 | 19,711 | 18,974 | ||
| Methyl alcohol(67-56-1) | 0 | 0 | 0 | ||
| Total emissions/Revenues | kg/KRW billion | 288.8 | 254.5 | 230.5 | |
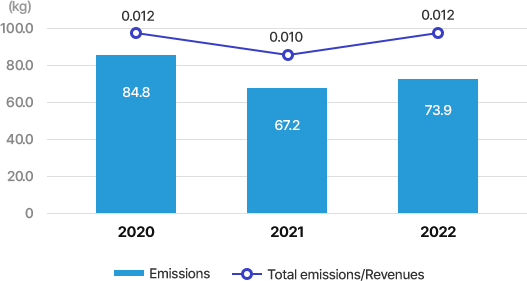
| Unit | 2020 | 2021 | 2022 | ||
|---|---|---|---|---|---|
| Total Emissions | ㎏ | 84.8 | 67.2 | 73.9 | |
| Biological Oxygen Demand (BOD) | 0 | 0 | 12.7 | ||
| Chemical Oxygen Demand (COD) | 40.0 | 22.0 | 0 | ||
| Total Organic Carbon (TOC) | 0 | 0 | 19.2 | ||
| Suspended Substances (SS) | 14.0 | 25.0 | 8.1 | ||
| Total phosphorus (T-P) | 1.0 | 0 | 0.7 | ||
| Ammonia nitrogen (NH3-N) | 29.7 | 18.6 | 32.6 | ||
| Fluorine (F) | 0 | 0.3 | 0 | ||
| Heavy metals | 0.1 | 1.3 | 0.6 | ||
| Total emissions/Revenues | kg/KRW billion | 0.012 | 0.010 | 0.012 | |
| Unit | 2020 | 2021 | 2022 | ||
|---|---|---|---|---|---|
| Environmental investment | Total | KRW million | 12,825 | 17,072 | 14,612 |
| OPEX | 11,510 | 12,262 | 10,662 | ||
| CAPEX | 1,315 | 4,810 | 3,950 | ||
| Compared to revenus | % | 0.2 | 0.3 | 0.3 | |
| Environmental education (including internal supplier) | Total | Hr | 172,917 | 138,366 | 120,806 |
| Unit | 2020 | 2021 | 2022 | ||
|---|---|---|---|---|---|
| Violations | Violation | Cases | 0 | 0 | 0 |
| Environmental accidents | Cases | 0 | 0 | 0 | |
| Penalties | KRW | 0 | 0 | 0 | |
| Sanctions | Cases | 0 | 0 | 0 | |
| Amount of damages | KRW | 0 | 0 | 0 | |
| Stakeholders | Complaints | Cases | 0 | 0 | 0 |
| Percentage of actions taken | % | N/A | N/A | N/A | |
| Monetary compensation | KRW | N/A | N/A | N/A |
| Unit | 2020 | 2021 | 2022 | ||
|---|---|---|---|---|---|
| Habitat protection | Habitats protected or recovered | places | 4 | 4 | 41) |
| Classification of protected animals and plants | IUCN(International Union for the Conservation of Nature and Natural Resources)-designated endangered species | Species | 0 | 0 | 0 |
| state-designated endangered species | Species | 1 | 1 | 22) | |
| Kinds of wild animals and plants protected | Species | 55 | 60 | 51 | |
| Post-environmental impact assessment costs | KRW 100 million | 2.4 | 2.4 | 2.3 | |
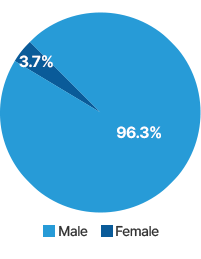
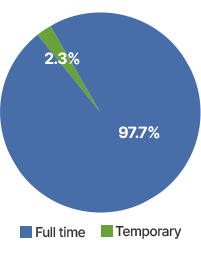
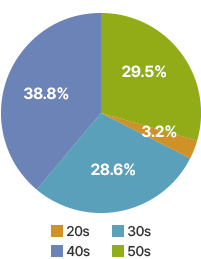
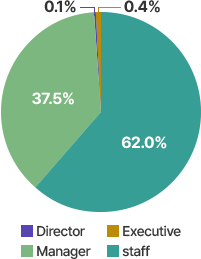
| Gender | Male | 96.3% | Contract type | Full time | 97.7% |
|---|---|---|---|---|---|
| Female | 3.7% | Temporary | 2.3% | ||
| Age | 20s | 3.2% | Position | Director | 0.1% |
| 30s | 28.6% | Executive | 0.4% | ||
| 40s | 38.8% | Manager | 37.5% | ||
| 50s | 29.5% | staff | 62.0% |
| Unit | 2020 | 2021 | 2022 | ||
|---|---|---|---|---|---|
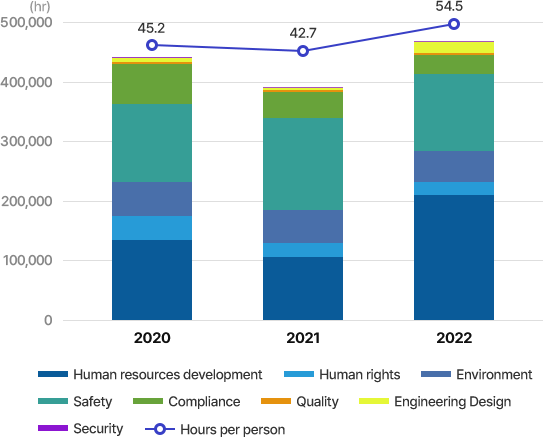
| Total | Hr | 447,329 | 396,412 | 478,195 | |
| Human resources development1) | 135,914 | 107,019 | 212,075 | ||
| Human rights | 39,692 | 24,014 | 21,970 | ||
| Environment | 59,316 | 55,674 | 52,650 | ||
| Safety | 134,503 | 157,145 | 132,181 | ||
| Compliance | 67,590 | 44,919 | 37,135 | ||
| Quality | 2,860 | 2,540 | 2,380 | ||
| Engineering Design | 5,856 | 3,520 | 18,360 | ||
| Security | 1,598 | 1,581 | 1,444 | ||
| Hours per person | Hr | 45.2 | 42.7 | 54.5 | |
| Unit | 2020 | 2021 | 2022 | |
|---|---|---|---|---|
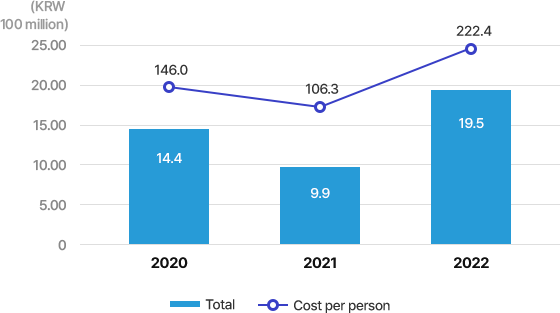
| Total cost | KRW 100 million | 14.4 | 9.9 | 19.5 |
| Cost per person | KRW thousand | 146.0 | 106.3 | 222.4 |
[ Tier 1 supplier ]
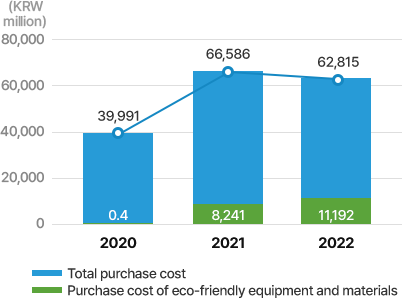
[ Purchase cost ]
| Unit | 2020 | 2021 | 2022 | ||
|---|---|---|---|---|---|
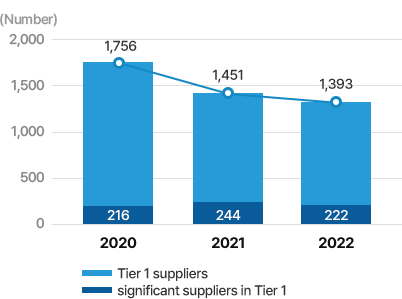
| Tier 1 suppliers | companies | 1,756 | 1,451 | 1,393 | |
| Significant suppliers in Tier 11) | 216 | 244 | 222 | ||
| Suppliers assessed | 216 | 244 | 222 | ||
| Purchase cost | KRW 100 million | 39,991 | 66,586 | 62,815 | |
| Eco-friendly equipment and materials2) | 0.4 | 8,241 | 11,192 | ||
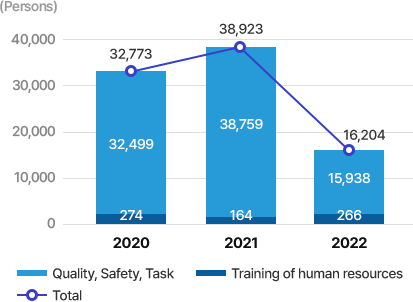
[ Training support ]
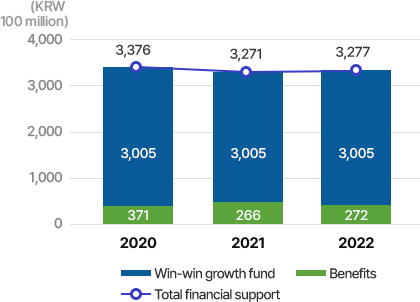
[ Financial support ]
| Unit | 2020 | 2021 | 2022 | ||
|---|---|---|---|---|---|
| Education support | Persons | 32,773 | 38,923 | 16,204 | |
| Quality, Safety, Task | 32,499 | 38,759 | 15,938 | ||
| Training of human resources | 274 | 164 | 266 | ||
| Financial support | KRW 100 million | 3,376 | 3,271 | 3,277 | |
| Benefits | 371 | 266 | 272 | ||
| Winwin growth fund | 3,005 | 3,005 | 3,005 | ||
| Percentage of cash payment monitoring amount1) | % | 66 | 75 | 73 | |
| Unit | 2020 | 2021 | 2022 | ||
|---|---|---|---|---|---|
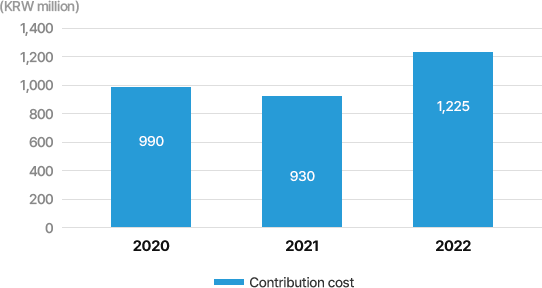
| Contribution cost | KRW Million | 990 | 930 | 1,225 | |
| Company | 250 | 250 | 574 | ||
| Employee | 740 | 680 | 651 | ||
| Employee contributed | Persons | 7,524 | 6,116 | 6,356 | |
| Unit | 2020 | 2021 | 2022 | |
|---|---|---|---|---|
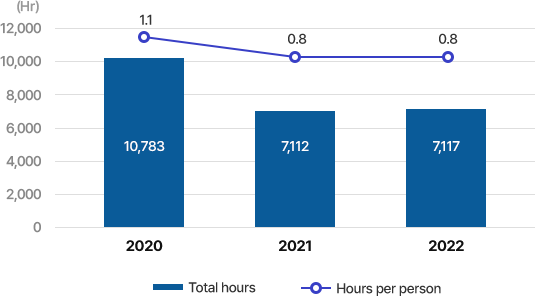
| Total hours | Hr | 10,783 | 7,112 | 7,117 |
| Hours per person | 1.1 | 0.8 | 0.8 |
| Unit | 2020 | 2021 | 2022 | ||
|---|---|---|---|---|---|
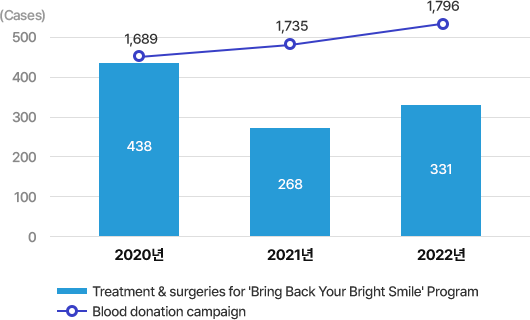
| Periodic blood donation campaign | Blood donation | Cases | 1,689 | 1,735 | 1,796 |
| 'Bring Back Your Bright Smile' Program1) | Treated persons | Persons | 11 | 9 | 59 |
| Treatments | Cases | 386 | 238 | 287 | |
| Surgeries | 52 | 30 | 44 | ||
| Amount of support | KRW million | 500 | 500 | 500 |
| Unit | 2020 | 2021 | 2022 | ||
|---|---|---|---|---|---|
| Safety indicators (employee + internal supplier) |
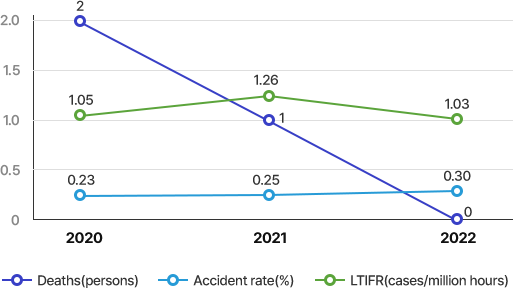
Deaths | Persons | 2 | 1 | 0 |
| Accident rate1) | % | 0.23 | 0.25 | 0.30 | |
| LTIFR2) | cases/million hours | 1.05 | 1.26 | 1.03 | |
| Awards and recognition | Amounts | KRW million | 215 | 163 | 152 |
| Cases | number | 212 | 176 | 193 | |
| Inspection, Exercise | Internal | cases | 340 | 350 | 350 |
| Emergency response | 165 | 157 | 152 |
| Unit | 2020 | 2021 | 2022 | ||
|---|---|---|---|---|---|
| Medical examination | General | Persons | 847 | 770 | 537 |
| Comprehensive | 9,265 | 8,573 | 6,726 | ||
| Other activicties | Use of internal clinics | counts | 57,189 | 42,180 | 48,510 |
| Vaccination | % | 90 | 60 | 94 | |
| Anti-smoking clinic | Persons | 8,289 | 5,596 | 0 (Not implemented due to COVID-19) |
Information related to the board of directors can be found on the 'Investment Information-Governance-Board of Directors' section of the company's website.
| Unit | 2020 | 2021 | 2022 | ||
|---|---|---|---|---|---|
| Self inspection | Target personnel | Persons | 5,270 | 4,919 | 4,433 |
| Inspection rate | % | 98.3 | 98.2 | 98.3 | |
| Advice | Total | Cases | 1,466 | 1,730 | 1,707 |
| Compliance | 365 | 606 | 536 | ||
| Legal | 1,101 | 1,124 | 1,171 | ||
| Training | CL, CM, CA1) | Hr | 1,139 | 1,144 | 1,311 |
| By job grade | 10,206 | 294 | 4,592 | ||
| By devision | 33,387 | 34,189 | 30,965 | ||
| Anti-corruption | 22,152 | 8,714 | 10,080 | ||
| Other special trainings2) | 597 | 425 | 113 | ||
| External Seminar and Conference | 109 | 153 | 153 |
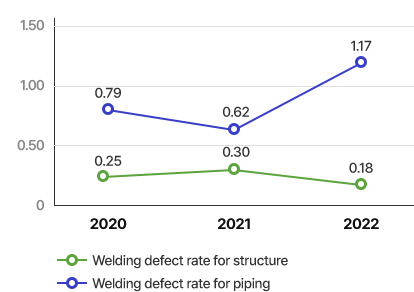
[ Welding defect rate
(structure, piping) ]
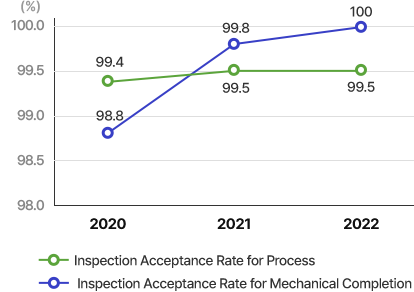
[ Inspection Acceptance Rate
(Process, Mechanical completion) ]
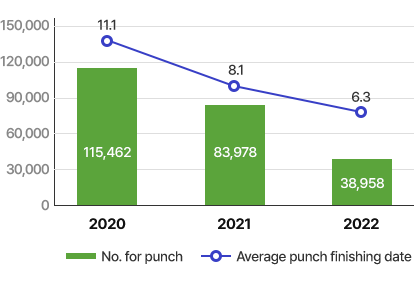
[ Punch1) ]
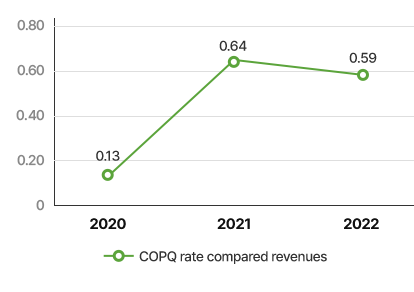
[ COPQ2) ]
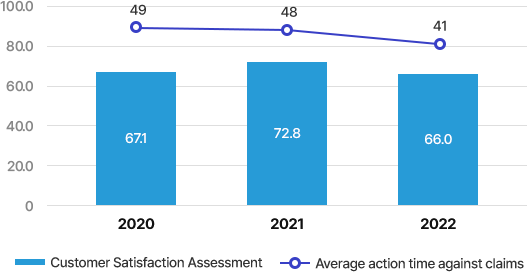
| Unit | 2020 | 2021 | 2022 | ||
|---|---|---|---|---|---|
| Customer Satisfaction Assessment1) | Points | Points | 67.1 | 72.8 | 66.0 |
| No. of customer company received | Companies | 19 | 18 | 16 | |
| Response to customer complaints | No. of claims received | Cases | 10,433 | 11,991 | 9,717 |
| Average action time against claims2) | Days | 49 | 48 | 41 |
| Unit | 2020 | 2021 | 2022 | ||
|---|---|---|---|---|---|
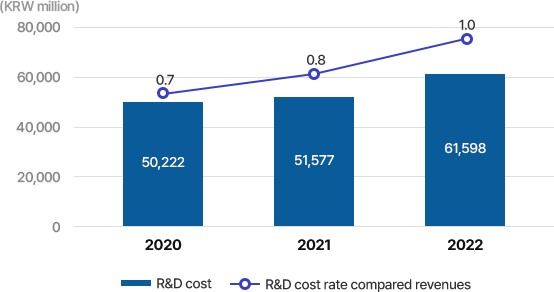
| R&D cost | KRW million | 50,222 | 51,577 | 61,598 | |
| CAPEX | 6,342 | 10,239 | 7,800 | ||
| OPEX | 43,880 | 41,338 | 53,798 | ||
| Compared revenues | % | 0.7 | 0.8 | 1.0 | |
| Number of R&D personnel | 명 | 338 | 338 | 370 | |
| Intellectual property rights1) | Cases | 189 | 101 | 285 | |
| Patent | 168 | 97 | 250 | ||
| Utility Model | 5 | 2 | 6 | ||
| Design | 8 | 0 | 21 | ||
| Trademark and software copyright | 8 | 2 | 8 | ||
| Unit | 2020 | 2021 | 2022 | ||
|---|---|---|---|---|---|
| Business continuity/Contingent risk response test | Cases | 2 | 2 | 2 | |
| DDoS attack dissemination training | 1 | 1 | 1 | ||
| DR disaster recovery training | 1 | 1 | 1 | ||
| External inspection and vulnerability analysis | Cases | 25 | 43 | 44 | |
| External system Security inspection | 회 | 21 | 36 | 33 | |
| - Regular security inspection on integrated security center website | 1 | 1 | 1 | ||
| - Automatic detection and inspection of security vulnerabilities on SHI website | 12 | 12 | 12 | ||
| - Security inspection on mobile applications/web application | Always | Always | Always | ||
| - Security inspection before applying modification/adding in mobile applications/web applications | 8 | 23 | 20 | ||
| Internal system Security inspection | 회 | 4 | 7 | 11 | |
| - Regular security inspection on internal system holding private information | 1 | 1 | 1 | ||
| - Security inspection on internal applications | Always | Always | Always | ||
| - Inspection on internal applications before applying/adding modification | 3 | 6 | 10 | ||
 |
 |
 |
 |
 |
 |
|---|---|---|---|---|---|
| KOREA | B | Medium | C- | A (E:A, S:A+, G:B+) | B- |